What is Flourish Data Visualisation?


Flourish: What is it? Essentially, Flourish is a free visualisation suite, where you can upload your data and generate a wide range of data visualisations, from straightforward bar graphs and charts to interactive story maps. Using any data that can be entered into a spreadsheet, Flourish is a potent data visualisation tool that enables users to easily build sophisticated views of data and stories. Any concept you want to exhibit can be represented by this data, including time, population, location, and more.
Flourish was developed to make it possible for anybody to write, share, and easily communicate a story using data. The platform, which was introduced in 2018, is used by a sizable community of producers to educate tens of millions of visitors every day.
Flourish demonstrates its power in the way it thrives on customisation as well as the complex handling of data and the way it appears on a graph or map. Some more well-known visualisations available on Flourish include but are not limited to: line, bar, and pie charts projection maps
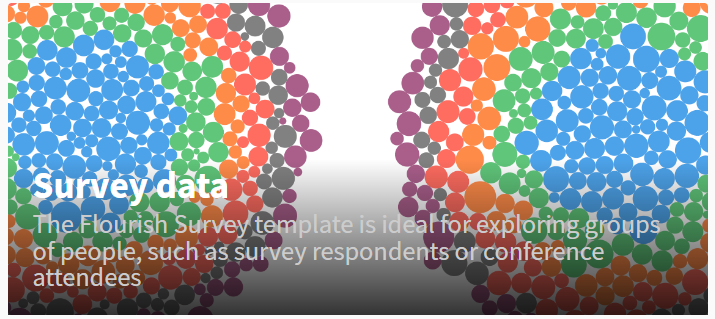
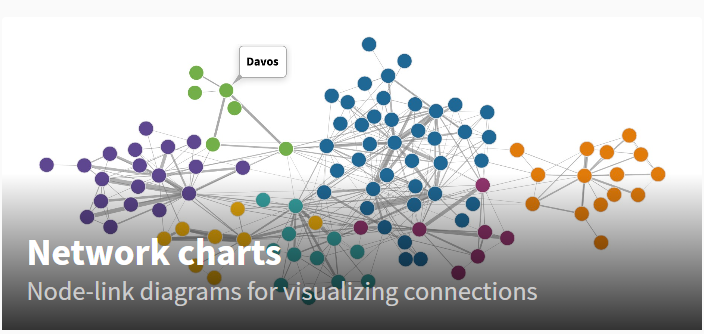
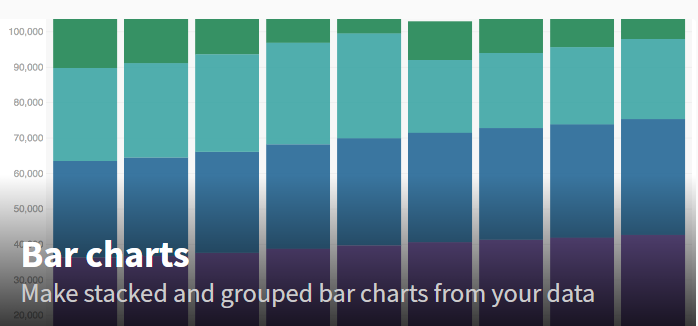
Here are a few examples of Flourish visualisation graphs.
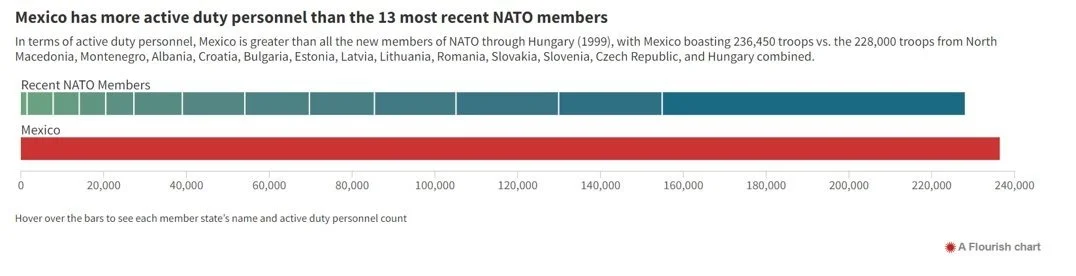
Source: Flourish
This is a bubble plot data visualization by Flourish. It shows how Mexico compare to NATO’s newest members
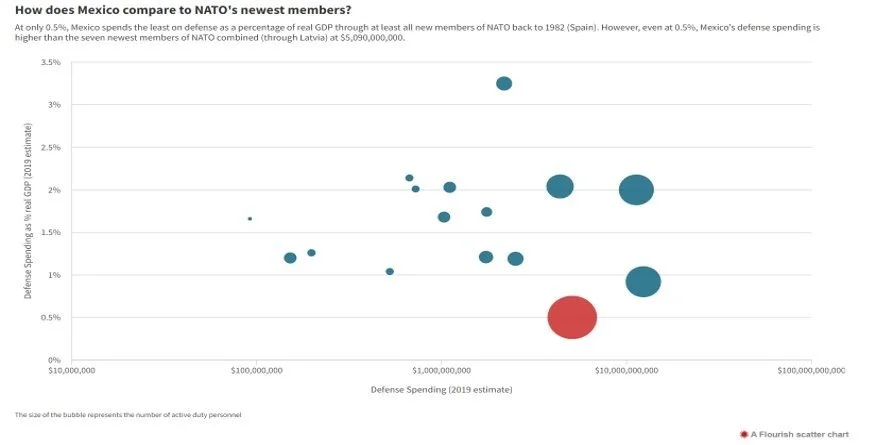
We at Butterfly Data always pride ourselves in the learning and understanding of new data management tools that will enable us to tell good data stories. I came across this tool when I was carrying research on NATO’s relationship between Saudi Arabia and Mexico. The tool proved simple to use and effective in quickly developing the charts above, visualisation aids which allow any viewer to efficiently take in complex correlations.
It is important as a Data Analyst, to always have an open mind when it comes to using different types of software, and here we have found another data visualisation suite that can hold its own in an increasingly expansive market.
Ready to transform your data?
Book your free discovery call and find out how our bespoke data services and solutions could help you uncover untapped potential and maximise ROI.