

The Digital Sandbox
What is the Digital Sandbox?
Butterfly Data are proud to have taken part in the Digital Sandbox Sustainability Cohort this year. Successful Companies, selected by the Financial Conduct Authority (FCA) and City of London Corporation (COCL), were challenged to tackle problems in finance to aid understanding, validating, and disclosure of Environmental, Social and Corporate Governance (ESG) data.
The Sandbox was built to accelerate market-applicable solutions by providing mentorship, data, and collaboration opportunities.

HardiKupreti (2021) Fastest things on Earth [Online] Available from: https://www.reddit.com/r/MemeTemplatesOfficial/comments/kgtakw/fastest_things_on_earth/. Last Accessed: 25/04/2022
What is ESG?
ESG data captures information about a company and how it behaves. Similarly to credit scores, there are multiple different providers of ESG metrics, e.g. MSCI, REFINITIV, ESG Enterprise.
ESG metrics aim to encapsulate many factors involving a company, some of which are shown below.

Source: Fidelity (2018) What is ESG investing? [Online] Available from: https://www.fidelity.com.sg/beginners/esg-investing/what-is-esg . Last Accessed: 25/04/2022
What was the problem we identified?
Currently, ESG dashboards and guides are predominantly aimed at companies, however public consumer demand is on the rise. In the last year, there has been a sharp increase in the number of public investors through apps such as Robin Hood and eToro, to name just a few. There has also been an increase in the public perception of ESG issues through such activist groups as Insulate Britain and Extinction Rebellion. Nonetheless, consumers do not presently have an accessible, simple, or data-driven method to compare which of the possible investments best suits their non-financial preferences and values.
We have also identified that, within the industry, there was an imbalance in the understanding and availability between the environmental, social, and governing aspects of the ESG metric. So, with our work in the Digital Sandbox, we set out to achieve a better understanding of these relationships and dynamics.
What was our Proposal?
Our initial proposal was to build a dashboard that would compare the ESG metrics for different investment opportunities. This dashboard could be a support tool for the public to make validated and more informed decisions. A key part of this involves not just providing the data, but also providing an accessible platform that can be understood by a whole host of users. To help improve the consumer’s understanding of ESG through the dashboard, metrics were to be clearly documented and the dashboard itself was designed to be extensively customisable for the user. However, as our project in the Sandbox matured we found that it was much more feasible to work with the readily available ESG information from ‘ESG Enterprise’ and to create a dashboard which allowed the end user to customise the weightings between the E, S, and G portions and for us to then gather insights from this behavior.
What was our Solution?
We created a dashboard which would enable investors to better understand ESG Data. We designed the dashboard to be accessible and intuitive regardless of background knowledge. Our outcome from the project was to record customer engagement with the dashboard. This customer metadata we hoped to analyse, to gather insight about the customers’ understanding and behavior around ESG data. The dashboard was populated using data through the ESG Enterprise API and the AlphaVantage API. ESG Enterprise provided company ESG information broken down into the individual Environmental, Social, and Corporate Governance modules. AlphaVantage was used to provide stock price information, to give these stocks a financial context.
We are currently looking to undertake the next step of development with the dashboard project before undertaking user testing and beginning to gather insight. Below are a selection of screenshots of the dashboard, however as it is currently hosted on Google Cloud Platform, the dashboard can be found and tried out here:
https://esg-dashboard-dot-esg-dashboard-599434.nw.r.appspot.com/
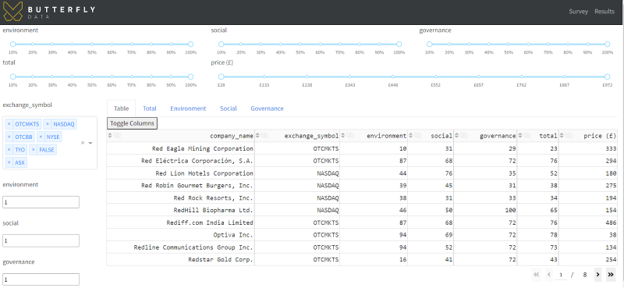
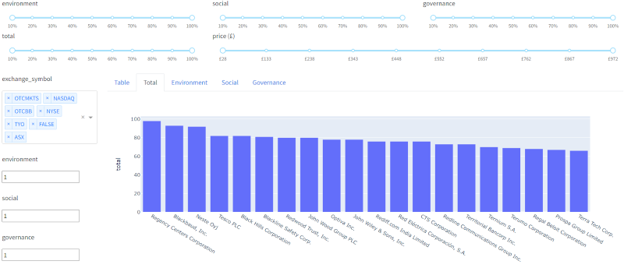
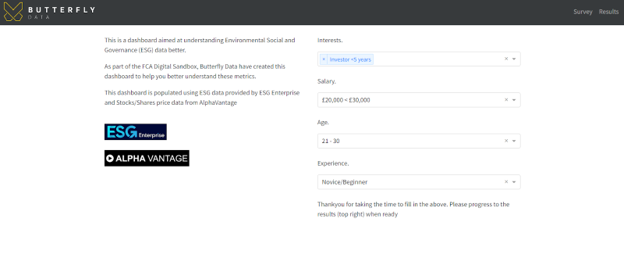
There are two pages of the dashboard, the first is a landing page for the user with a short description of the Sandbox in addition to a short, optional survey to enrich the dashboard data that will be collected.

The second page of the dashboard provides a tabular or graphical view of the companies and the ESG Enterprise metric. There are slider bars to allow the user to filter the companies by percentiles for E, S, and G independently. There is the option to filter by the ESG total and the approximate stock price. Along the left hand side there is the ability to filter by stock exchange and then the option to weight the E, S, and G parts of the ESG metric by different amounts. By default these are 1:1:1 but the choice is there for someone to alter these to place more focus on Environment for example 2:1:1.
We hope this has been an interesting view of our current work on ESG data, and that it inspires you to look at the output of this dashboard work - and perhaps even spend some further time researching and considering the impact of ESG data on the future of the financial market.